
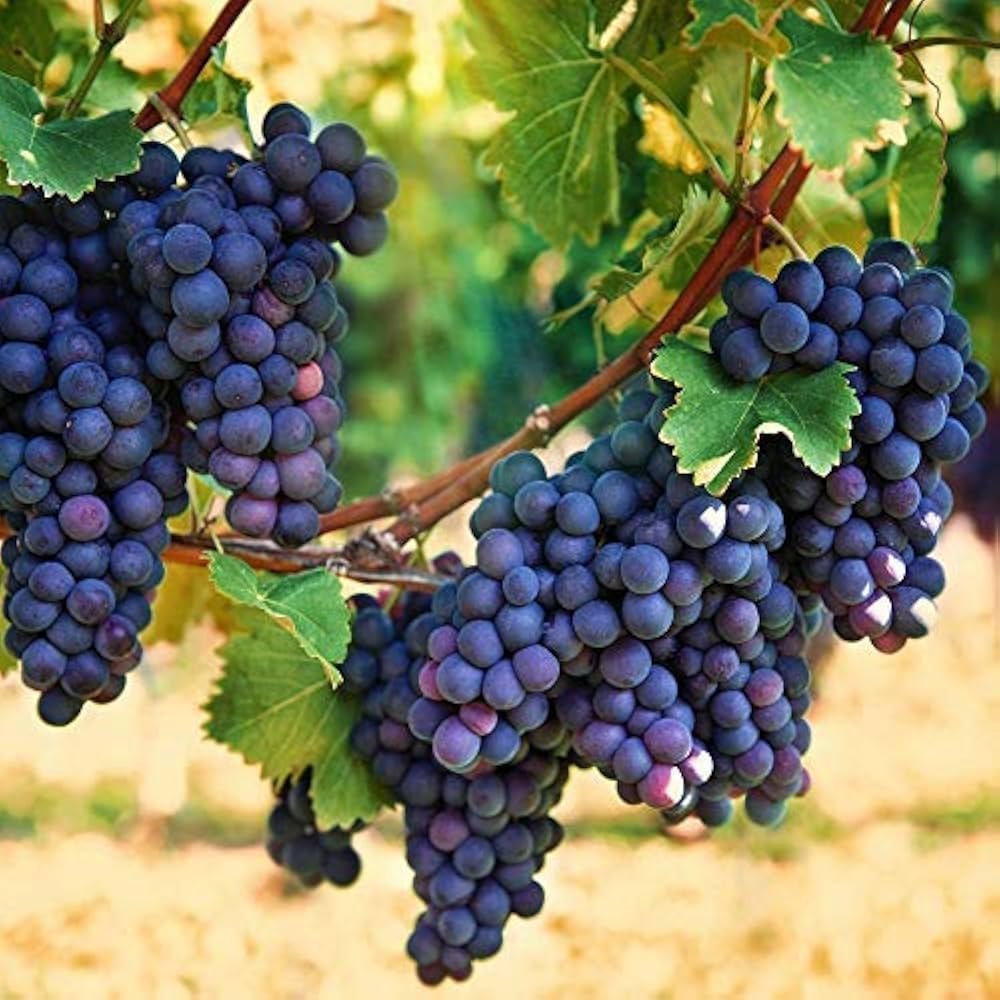

TablegrapesgrowninMaharashtrahavetwo pruningbutonefruityieldperannum.
Article No. 41 Mr.RavindraThatte
Pruningdone aroundApril is foundation pruning,followed by fruit pruningaroundOctober. Generally, thereis 20 to 40 days post-harvest stage before the foundation pruning of next year.
Knowing annualuptakeof nutrientsas pergrowthstages is veryimportant in developing fertilizer program.Partitioning ofNutrienttovariousorgansandhownutrientsarestoredintheplantisalso veryusefulinformation forgoodIntegrated Nutrient management (INM). Knowing the removal from the field is fundamental to a good fertilisation programme.
It must be noted that uptake of nutrientsdoesnot directly correspond with fertilizer requirement,because: Some of the Nutrient:
•comesfromsoilmineralisation,
•comesfromorganicmatter,
•is remobilisedfromperennialwoodandroots,
•isrecycledfromfallenleaves,
•remainsinshoots/canes,
•comesfromirrigationwater,
•andsomeisreturnedto thesoilthroughpruningresidues.
It must also benoted thatearly growth initially dependspartly on remobilisation frompermanent structuresbecause root uptake does not immediately match shoot demand.
Scientificpublished data for uptakeofplant nutrients for Thompsonseedlessgiving25 ton /Ha (10ton/acre)yieldis available(Wasnik&Bhargava).ManyfarmersinMaharashtraareachievingyieldof15ton/acre(37ton/Ha).Wehave
scaledup thisinformationforyieldof15 ton /acreper annum to showuptakeof variousnutrients as perseason and there utilisation by various plant organs.
15t/acreofgrapesdoesNOTmean15t/acreofplantdry matter.
Asper NRCGrapesPune,Thompson Seedlessbuncheshad approximately 24.42%dry matter,whileshootshad approximately 40.17%, leaves/petioles considerably less, and permanent tissues much higher.
Therefore:
15000 kgfresh grapes×24.42% = ≈3663 kgdrymatterinharvested grapes =3.66 tdrymatter/acre. Total vine biomass is much larger
A Thompson Seedlessstudymeasured approximately 13.1kgdrybiomasspervine,with about43%below ground at the assessment point.
Maharashtra Thompson Seedlessresearch alsodemonstratessubstantialdry-matter storage in trunk,cordons,canes and roots, and confirms that rootstock has a significant influence on dry-matter distribution.
Therefore, for a 15 t/acre Maharashtra vineyard a working biomass estimate is as follows( It is again emphasised thatthe informationpresented below isnotbasedonactualmeasuredreplicated studies,but based on models usingavailable data ) :
Approximateannualbiomassbudget
|
Biomasspool |
Workingrange |
|
Harvestedgrapefreshweight |
15t/acre |
|
Harvestedgrapedrymatter |
~3.66t/acre |
|
Annualleaves |
~0.8–1.6t DM/acre |
|
Annualshoots/canes |
~1.21–2.42tDM/acre |
|
New/reallocatedperennialbiomass |
~0.40–1.4t DM/acre |
|
Rootgrowth/replacement |
~0.8– 1.6tDM/acre |
|
Approximatetotalannualbiomass production |
~6.87–10.52tDM/acre |
For the15t/acreThompsonSeedlessvineyardinMaharashtra underthe double-pruningsystem. Table : 1 Foundation Pruning cycle
PhysiologyStagewiseutilisationofNutrientsbyThompsonseedless@15tons/acre
Peracre
|
DAP from foundation pruning |
Physiologicalstage |
N kg |
P kg |
K kg |
Ca kg |
Mg kg |
S kg |
Fe g |
Mn g |
Zn g |
B g |
Cu g |
|
0–15 |
Budburst/initialshoot growth |
3.0 |
0.5 |
2.0 |
2.0 |
0.5 |
0.4 |
25 |
15 |
8 |
8 |
3 |
|
16–30 |
Earlyshootgrowth |
5.0 |
0.8 |
4.0 |
3.0 |
0.8 |
0.7 |
40 |
25 |
12 |
12 |
5 |
|
31–45 |
Rapidvegetativegrowth |
8.0 |
1.4 |
7.0 |
5.0 |
1.2 |
1.1 |
65 |
40 |
20 |
18 |
7 |
|
46–60 |
Canopyexpansion |
10.0 |
1.7 |
9.0 |
6.5 |
1.5 |
1.4 |
80 |
50 |
25 |
22 |
9 |
|
61–75 |
Mature shoot /leaf development |
8.0 |
1.4 |
8.0 |
6.5 |
1.6 |
1.2 |
70 |
45 |
22 |
20 |
8 |
|
76–90 |
Shootmaturation/storage |
5.0 |
0.9 |
5.0 |
5.0 |
1.2 |
0.8 |
45 |
30 |
15 |
14 |
5 |
|
91–105 |
Pre-fruitpruning |
3.0 |
0.5 |
3.0 |
3.5 |
0.8 |
0.5 |
25 |
18 |
9 |
9 |
3 |
|
Foundation -cycletotal |
42.0 |
7.2 |
38.0 |
31.5 |
7.6 |
6.1 |
350 |
223 |
111 |
103 |
40 |
Whatishappeninghere?
Thefoundationpruningisprincipallya biomass-buildingandreserve-buildingphase. AsubstantialamountofN,Ca, Mg, Fe, Mn and Zn is going into leaves and shoots rather than into marketable fruit.
Table2—Fruit-pruningcycle
PhysiologyStagewiseutilisationofNutrientsbyThompsonseedless@15tons/acre
Peracre
|
DAP from fruit pruning |
Stage |
N kg |
P kg |
K kg |
Ca kg |
Mg kg |
S kg |
Fe g |
Mn g |
Zn g |
B g |
Cu g |
|
0–15 |
Bud burst / rapid shoot initiation |
3.5 |
0.6 |
3.0 |
2.0 |
0.6 |
0.5 |
25 |
15 |
8 |
8 |
3 |
|
16–30 |
Shoot elongation / inflorescence development |
7.0 |
1.1 |
6.0 |
3.5 |
0.9 |
0.9 |
45 |
28 |
15 |
16 |
5 |
|
31–45 |
Pre-bloom/flowering |
9.0 |
1.5 |
8.0 |
5.0 |
1.1 |
1.2 |
55 |
35 |
18 |
25 |
7 |
|
46–60 |
Fruitset/berryinitiation |
11.0 |
1.8 |
11.0 |
6.5 |
1.4 |
1.4 |
65 |
40 |
22 |
32 |
8 |
|
61–75 |
Berryexpansion |
14.0 |
2.3 |
15.0 |
7.5 |
1.8 |
1.7 |
80 |
48 |
27 |
38 |
10 |
|
76–90 |
Rapidberrygrowth/veraison |
13.0 |
2.2 |
16.0 |
7.0 |
1.8 |
1.6 |
75 |
45 |
26 |
35 |
10 |
|
91–105 |
Veraison/ripening |
10.0 |
1.7 |
12.0 |
5.5 |
1.4 |
1.2 |
55 |
32 |
19 |
25 |
7 |
|
106–120 |
Finalripening/harvest |
5.0 |
0.9 |
6.0 |
3.0 |
0.8 |
0.7 |
30 |
20 |
11 |
15 |
4 |
|
Fruit-cycle total |
72.5 |
12.1 |
77.0 |
40.0 |
9.8 |
9.2 |
430 |
263 |
146 |
194 |
54 |
Thisistheeconomicallymostimportantnutrient-partitioning period.
Thistableshowsanimportantpoint Kbecomesdisproportionatelyimportantafterfruitset
ThepublishedseasonalgrapevineresearchconfirmsthatKuptakebecomesparticularlyimportantduringfruit development, while Ca has strong uptake during fruit development/maturation.
Table3—Post-harvestrecoveryandreservereplenishment
PhysiologyStagewiseutilisationofNutrientsbyThompsonseedless@15tons/acre
Per/acre
|
Days after harvest |
Physiologicalphase |
N kg |
P kg |
K kg |
Ca kg |
Mg kg |
S kg |
Fe g |
Mn g |
Zn g |
B g |
Cu g |
|
0–10 |
Harvestrecovery |
3.0 |
0.5 |
2.0 |
3.0 |
0.6 |
0.4 |
20 |
12 |
6 |
7 |
2 |
|
11–20 |
Activepost-harvestleaves |
4.0 |
0.7 |
2.5 |
4.0 |
0.8 |
0.5 |
30 |
18 |
8 |
9 |
3 |
|
21–30 |
Reserveaccumulation |
4.0 |
0.7 |
3.0 |
4.5 |
0.9 |
0.6 |
35 |
20 |
10 |
10 |
3 |
|
31–45 |
Reserve storage / cane maturation |
4.0 |
0.7 |
3.0 |
4.5 |
0.9 |
0.6 |
35 |
20 |
10 |
10 |
3 |
|
46–60 |
Senescence/recycling |
2.0 |
0.4 |
1.7 |
4.2 |
0.8 |
0.4 |
20 |
12 |
6 |
7 |
2 |
|
Post-harvest total |
17.0 |
3.0 |
12.2 |
20.2 |
4.0 |
2.5 |
140 |
82 |
40 |
43 |
13 |
Note:PostharvestNuptake isdependentonsoil type,vinevigour,climate,rootstock,cropload,lengthof post-harvest period & hence should not be taken as constant.
Thisis the partthat is often missed inannual nutrient calculations.For aMaharashtradouble-prunedvineyard,the cropcycle is notfinishedat harvest.Thevinecontinuestoassimilateandredistributenutrientsintoperennialorgansand reserves
Table4—Consolidatedannualbiological uptake
Addingthethreephasesgivesapproximately:%of nutrientsfoundinvariousorgansofplantbasedonthe3stages
|
Nutrient |
Foundation |
Fruitcycle |
Post-harvest |
Annualuptake |
|
N |
42.0 |
72.5 |
17.0 |
131.5kg/acre |
|
P |
7.2 |
12.1 |
3.0 |
22.3kg/acre |
|
K |
38.0 |
77.0 |
12.2 |
127.2kg/acre |
|
Ca |
31.5 |
40.0 |
20.2 |
91.7kg/acre |
|
Mg |
7.6 |
9.8 |
4.0 |
21.4kg/acre |
|
S |
6.1 |
9.2 |
2.5 |
17.8kg/acre |
|
Fe |
350 |
430 |
140 |
920g/acre |
|
Mn |
223 |
263 |
82 |
568g/acre |
|
Zn |
111 |
146 |
40 |
297g/acre |
|
B |
103 |
194 |
43 |
340g/acre |
|
Cu |
40 |
54 |
13 |
107g/acre |
Nutrient partitioning among plant organs, what percentage goes into roots trunk/cordon, shoots, leaves/petioles and reproductive organs/berries?
Thereis goodphysiological evidence that grapevinepartitioningchangesstronglywith growthstage. Inparticular,early growth dependssubstantially on stored root/perennial reserves; during flowering and berry development current root uptakebecomesdominant;andatharvestalargeproportionofseveralnutrientsisassociatedwith fruit,while N,Ca,Mg and micronutrients can remain strongly represented in vegetative organs.
TABLE 5—Foundation-pruningphase:PartitioningofNutrienttoorgans
Percentageofnutrientuptake allocatedtoorgans
|
Nutrient |
Roots |
% |
Trunk + cordon |
% |
Shoots /canes |
% |
Leaves + petioles |
% |
Inflorescence /fruit |
% |
Total |
|
N(kg) |
5.04 |
12 |
5.04 |
12 |
13.44 |
32 |
17.64 |
42 |
0.84 |
2 |
42 |
|
P(kg) |
1.08 |
15 |
1.08 |
15 |
2.16 |
30 |
2.66 |
37 |
0.22 |
3 |
7.2 |
|
K(kg) |
3.8 |
10 |
3.8 |
10 |
13.3 |
35 |
15.96 |
42 |
1.14 |
3 |
38 |
|
Ca(kg) |
3.78 |
12 |
6.3 |
20 |
9.45 |
30 |
11.34 |
36 |
0.63 |
2 |
31.5 |
|
Mg(kg) |
0.91 |
12 |
0.91 |
12 |
2.28 |
30 |
3.27 |
43 |
0.23 |
3 |
7.6 |
|
S(kg) |
0.73 |
12 |
0.73 |
12 |
1.95 |
32 |
2.56 |
42 |
0.12 |
2 |
6.1 |
|
Fe(g) |
63 |
18 |
53 |
15 |
88 |
25 |
140 |
40 |
7 |
2 |
350 |
|
Mn(g) |
27 |
12 |
27 |
12 |
62 |
28 |
103 |
46 |
4 |
2 |
223 |
|
Zn(g) |
17 |
15 |
17 |
15 |
31 |
28 |
44 |
40 |
2 |
2 |
111 |
|
B(g) |
10 |
10 |
15 |
15 |
29 |
28 |
45 |
44 |
3 |
3 |
103 |
|
Cu(g) |
18 |
18 |
25 |
37 |
2 |
Atthisstagethereisessentiallynomarketablefruitsink.Nutrientsarepredominantlygoingintonewshoots, leaves/petioles and replenishment of perennial structures.
Whatthistellsus
Duringfoundationpruning,thedominantnutrientsinkis:
Leaves/petioles→shoots→perennialwood→roots→reproductivestructures
Thisisparticularly important forN,Mg,Mn,Znand B,wherethedevelopingcanopy representsavery largesink.
TABLE6—Fruit-pruningphasePartitioningofNutrienttoorgans:
Percentageofnutrientuptake allocatedtoorgans
|
Nutrient |
Roots |
% |
Trunk + cordon |
% |
Shoots /canes |
% |
Leaves + petioles |
% |
Berries + reproductive organs |
% |
Total |
|
N(kg) |
7.25 |
10 |
5.8 |
8 |
15.95 |
22 |
18.13 |
25 |
25.38 |
35 |
72.5 |
|
P(kg) |
0.97 |
8 |
0.85 |
7 |
2.18 |
18 |
2.66 |
22 |
5.45 |
45 |
12.1 |
|
K(kg) |
4.62 |
6 |
3.85 |
5 |
11.55 |
15 |
14.63 |
19 |
42.35 |
55 |
77 |
|
Ca(kg) |
4.8 |
12 |
5.6 |
14 |
8.8 |
22 |
10 |
25 |
10.8 |
27 |
40 |
|
Mg(kg) |
0.78 |
8 |
0.69 |
7 |
1.76 |
18 |
2.45 |
25 |
4.12 |
42 |
9.8 |
|
S(kg) |
0.74 |
8 |
0.64 |
7 |
1.66 |
18 |
2.3 |
25 |
3.86 |
42 |
9.2 |
|
Fe(g) |
77 |
18 |
52 |
12 |
99 |
23 |
125 |
29 |
77 |
18 |
430 |
Thisiswherethepartitioningchangesdramaticallybecauseberriesbecomeamajorsink.
TheimportantpointisKFruit-pruningperiodasthemajorK-partitioningperiod.
Krequirement≠issimplyNOT"Krequiredto produce15tonnesofgrapes."
Thevinefirst needsKfor:
•leafexpansion,
•shoottransport,
•stomatalregulation,
•phloemloading,
•berrygrowth,
•sugartransportandaccumulation,
•osmoticregulation.
Kis strongly associatedwiththefruit-productionsink.
Forevery1kgofKtakenupduringthisphase,approximately:
•0.06kg→roots
•0.05kg→perennial wood
•0.15kg→shoots
•0.19kg→leaves
•0.55kg→reproductiveorgans/berries
ForB,thereproductivesinkisalsoparticularly strong:
~43%ofBuptake→berries/reproductiveorgans.
ThatisonereasonBnutritionbecomesparticularlyimportantaroundflowering→fruitset→earlyberry development
Table7—post-harvestrecoveryPartitioningofNutrienttoorgans:
Percentageofnutrientuptake allocatedtoorgans
|
Nutrient |
Roots |
% |
Trunk + cordon |
% |
Shoots /canes |
% |
Leaves / petioles |
% |
Remaining reproductive organs |
% |
Total |
|
N(kg) |
4.25 |
25 |
4.25 |
25 |
3.4 |
20 |
4.76 |
28 |
0.3 |
2 |
17 |
|
P(kg) |
0.75 |
25 |
0.84 |
28 |
0.6 |
20 |
0.75 |
25 |
0.1 |
2 |
3 |
|
K(kg) |
2.44 |
20 |
3.42 |
28 |
2.68 |
22 |
3.42 |
28 |
0.2 |
2 |
12.2 |
|
Ca(kg) |
3.64 |
18 |
7.07 |
35 |
4.44 |
22 |
4.85 |
24 |
0.2 |
1 |
20.2 |
|
Mg(kg) |
0.92 |
23 |
1.08 |
27 |
0.88 |
22 |
1.08 |
27 |
0.0 |
1 |
4 |
|
S(kg) |
0.58 |
23 |
0.63 |
25 |
0.55 |
22 |
0.73 |
29 |
0.0 |
1 |
2.5 |
|
Fe(g) |
35 |
25 |
42 |
30 |
25 |
18 |
36 |
26 |
1.0 |
1 |
140 |
|
Mn(g) |
16 |
20 |
23 |
28 |
16 |
20 |
25 |
31 |
1.0 |
1 |
81 |
|
Zn(g) |
10 |
25 |
11 |
28 |
8 |
20 |
11 |
28 |
0.4 |
1 |
40 |
|
B(g) |
9 |
21 |
13 |
30 |
9 |
21 |
12 |
28 |
0.4 |
1 |
43 |
|
Cu(g) |
3.3 |
25 |
4.2 |
32 |
2.3 |
18 |
3.1 |
24 |
0.1 |
1 |
13 |
This phaseis particularlyimportantin Maharashtrabecausethevinehasto recover its nutrient reserves before the next cycle.
Herethe root+trunk+cordon +surviving leaves becomemuch moreimportant,becausethevineisrebuilding its reserve pools. This is the reserve-building phase for use in the next growth cycle.
TableItoVshowSeasonaluptake&AssimilationofPlantnutrientsinvariousorgans
TableITableIITableIII
|
Nutrient |
foundation |
Fruit pruning |
Post-harvest |
Total |
foundation |
Fruit pruning |
Post-harvest |
Total |
foundation |
Fruit pruning |
Post-harvest |
Total |
||
|
Roots |
0 |
Trunk+cordon |
Shoots/canes |
|||||||||||
|
N(kg) |
5.04 |
7.25 |
4.25 |
16.54 |
5.04 |
5.8 |
4.25 |
15.09 |
13.44 |
15.95 |
3.4 |
32.79 |
||
|
P (kg) |
1.08 |
0.97 |
0.75 |
2.8 |
1.08 |
0.85 |
0.84 |
2.77 |
2.16 |
2.18 |
0.6 |
4.94 |
||
|
K(kg) |
3.8 |
4.62 |
2.44 |
10.86 |
3.8 |
3.85 |
3.42 |
11.07 |
13.3 |
11.55 |
2.68 |
27.53 |
||
|
Ca(kg) |
3.78 |
4.8 |
3.64 |
12.22 |
6.3 |
5.6 |
7.07 |
18.97 |
9.45 |
8.8 |
4.44 |
22.69 |
||
|
Mg(kg) |
0.91 |
0.78 |
0.92 |
2.61 |
0.91 |
0.69 |
1.08 |
2.68 |
2.28 |
1.76 |
0.88 |
4.92 |
||
|
S(kg) |
0.73 |
0.74 |
0.58 |
2.05 |
0.73 |
0.64 |
0.63 |
2 |
1.95 |
1.66 |
0.55 |
4.16 |
||
|
Fe(g) |
63 |
77 |
35 |
175 |
53 |
52 |
42 |
147 |
88 |
99 |
25 |
212 |
||
|
Mn(g) |
27 |
37 |
16 |
80 |
27 |
26 |
23 |
76 |
62 |
53 |
16 |
131 |
||
|
Zn(g) |
17 |
18 |
10 |
45 |
17 |
13 |
11 |
41 |
31 |
28 |
8 |
67 |
||
|
B(g) |
10 |
16 |
9 |
35 |
15 |
14 |
13 |
42 |
29 |
33 |
9 |
71 |
||
|
Cu(g) |
7 |
8 |
3.3 |
18.3 |
7 |
6 |
4.2 |
17.2 |
10 |
11 |
2.3 |
23.3 |
||
|
139.34 |
175.16 |
85.88 |
400.38 |
136.86 |
128.43 |
110.49 |
375.78 |
262.58 |
265.9 |
72.85 |
601.33 |
|||
TableIVTableV
|
Nutrient |
foundation |
Fruit pruning |
Post-harvest |
Total |
foundation |
Fruit pruning |
Post-harvest |
Total |
|
|
Leaves+petioles |
Inflorescence /fruit |
Berries+ reproductive organs |
Remaining reproductive organs |
||||||
|
N(kg) |
17.64 |
18.13 |
4.76 |
40.53 |
0.84 |
25.38 |
0.34 |
26.56 |
|
|
P (kg) |
2.66 |
2.66 |
0.75 |
6.07 |
0.22 |
5.45 |
0.06 |
5.73 |
|
|
K(kg) |
15.96 |
14.63 |
3.42 |
34.01 |
1.14 |
42.35 |
0.24 |
43.73 |
|
|
Ca(kg) |
11.34 |
10 |
4.85 |
26.19 |
0.63 |
10.8 |
0.2 |
11.63 |
|
|
Mg(kg) |
3.27 |
2.45 |
1.08 |
6.8 |
0.23 |
4.12 |
0.04 |
4.39 |
|
|
S(kg) |
2.56 |
2.3 |
0.73 |
5.59 |
0.12 |
3.86 |
0.03 |
4.01 |
|
|
Fe(g) |
140 |
125 |
36 |
301 |
7 |
77 |
1 |
85 |
|
|
Mn(g) |
103 |
82 |
25 |
210 |
4 |
66 |
1 |
71 |
|
|
Zn(g) |
44 |
41 |
11 |
96 |
2 |
47 |
0.4 |
49.4 |
|
|
B(g) |
45 |
49 |
12 |
106 |
3 |
83 |
0.4 |
86.4 |
|
|
Cu(g) |
15 |
16 |
3.1 |
34.1 |
1 |
12 |
0.1 |
13.1 |
|
|
400.43 |
363.17 |
102.69 |
866.29 |
20.18 |
376.96 |
3.81 |
400.95 |
||
Table8:completeannualorganbudget:Totalannualnutrientaccumulationbyorgan
|
Nutrient |
Roots |
% |
Trunk+ cordon |
% |
Shoots /canes |
% |
Leaves+ petioles |
% |
Inflorescence /fruit |
% |
Total |
% |
|
N(kg) |
16.54 |
12.58 |
15.09 |
11.47 |
32.79 |
24.93 |
40.53 |
30.82 |
26.56 |
20.20 |
131.51 |
100.00 |
|
P(kg) |
2.80 |
12.55 |
2.77 |
12.42 |
4.94 |
22.14 |
6.07 |
27.21 |
5.73 |
25.68 |
22.31 |
100.00 |
|
K(kg) |
10.86 |
8.54 |
11.07 |
8.70 |
27.53 |
21.64 |
34.01 |
26.74 |
43.73 |
34.38 |
127.20 |
100.00 |
|
Ca(kg) |
12.22 |
13.33 |
18.97 |
20.69 |
22.69 |
24.74 |
26.19 |
28.56 |
11.63 |
12.68 |
91.70 |
100.00 |
|
Mg(kg) |
2.61 |
12.20 |
2.68 |
12.52 |
4.92 |
22.99 |
6.80 |
31.78 |
4.39 |
20.51 |
21.40 |
100.00 |
|
S(kg) |
2.05 |
11.51 |
2.00 |
11.23 |
4.16 |
23.36 |
5.59 |
31.39 |
4.01 |
22.52 |
17.81 |
100.00 |
|
Fe(g) |
175.00 |
19.02 |
147.00 |
15.98 |
212.00 |
23.04 |
301.00 |
32.72 |
85.00 |
9.24 |
920.00 |
100.00 |
|
Mn(g) |
80.00 |
14.08 |
76.00 |
13.38 |
131.00 |
23.06 |
210.00 |
36.97 |
71.00 |
12.50 |
568.00 |
100.00 |
|
Zn(g) |
45.00 |
15.08 |
41.00 |
13.74 |
67.00 |
22.45 |
96.00 |
32.17 |
49.40 |
16.55 |
298.40 |
100.00 |
|
B(g) |
35.00 |
10.28 |
42.00 |
12.34 |
71.00 |
20.86 |
106.00 |
31.14 |
86.40 |
25.38 |
340.40 |
100.00 |
|
Cu(g) |
18.30 |
17.26 |
17.20 |
16.23 |
23.30 |
21.98 |
34.10 |
32.17 |
13.10 |
12.36 |
106.00 |
100.00 |
|
ColourCode
Thepicturebecomesquiteclear
For a 15-t/acre crop, the annual nutrient budget is approximately: Leaves/petioles arethelargest annualnutrient reservoir for most nutrients.
Shoots/canesarethesecond major vegetativereservoir. Important definition
•Harvestedgrapes=nutrientphysicallyleavingthevineyardinthe15t/acrecrop.
•Pruningmaterial=nutrientleavingthevineyardifprunedcanes/shootsareremovedfromthevineyard.
•Leaf-fall/pruningresiduereturned=nutrientscontainedinleaves/petiolesandanyshreddedpruningmaterialthatis returned/compostedin the vineyard.
•Permanentvinestructure=roots+trunk+cordonsandnutrientretainedthereattheendoftheannualcycle.
Table9:Nutrientpermanentlyremovedinharvestedgrapes
|
Nutrient |
Nutrientin harvested crop |
Nutrient |
Nutrientin harvested crop |
|
|
N |
26.6kg/acre |
Fe |
85g/acre |
|
|
P |
5.73kg/acre |
Mn |
71g/acre |
|
|
K |
43.73kg/acre |
Zn |
49g/acre |
|
|
Ca |
11.63kg/acre |
B |
86g/acre |
|
|
Mg |
4.39kg/acre |
Cu |
13g/acre |
|
|
S |
4.01kg/acre |
Table10:Nutrientremovedinpruningmaterial
Here we have todistinguish biomass pruned out frombiomass that remainsaspermanent structure.Ifthese canes are physically removed from the vineyard, that becomes a nutrient export.
|
Nutrient |
Removed in shoots/canes |
Nutrient |
Removed in shoots/canes |
|
|
N |
32.8kg/acre |
Fe |
212g/acre |
|
|
P |
4.94kg/acre |
Mn |
131g/acre |
|
|
K |
27.5kg/acre |
Zn |
67g/acre |
|
Ca |
22.7kg/acre |
B |
71g/acre |
|
|
Mg |
4.92kg/acre |
Cu |
23g/acre |
|
|
S |
4.16kg/acre |
ButthisisNOTnecessarilyavineyardnutrientloss.
Ifthegrower:prunes → shreds → decomposes/composts → returns to vineyard then mostofthisbecomesa recycling pool, not permanent removal.
Table11:Nutrientreturnedthroughleaffall+residues
wecannotsimplysaythat100% ofthesequantitiesarereturnedto soil.
Beforeleaffall, grapevinesremobilisesubstantialamounts ofmobile nutrientsfromleavesintoperennialorgans.N,P, K and B are particularly mobile; Ca and Mg are much less mobile.
Thefollowingisworkingrecyclingestimate:
|
Nutrient |
Leaf/residue pool |
Approx. potentially recycledin % |
Returned to soil working estimate |
Nutrient |
Leaf / residue pool |
Approx. potentially recycled |
Returned to soil working estimate |
|
|
N |
40.5 |
50 |
20.25 |
Fe |
301 |
88 |
264.88 |
|
|
P |
6.07 |
70 |
4.249 |
Mn |
210 |
80 |
168 |
|
|
K |
34 |
80 |
27.2 |
Zn |
96 |
70 |
67.2 |
|
|
Ca |
26.2 |
88 |
23.056 |
B |
106 |
60 |
63.6 |
|
|
Mg |
6.8 |
80 |
5.44 |
Cu |
34 |
80 |
27.2 |
|
|
S |
5.59 |
60 |
3.354 |
Table12:Nutrientretainedinpermanentvinestructure
Thisisnotanannualloss.Itisanutrientreservoir.Thisincludes:roots+trunk+cordons
|
Nutrient |
Roots |
Trunk + cordon |
Totalin Permanent structure |
Nutrient |
Roots |
Trunk + cordon |
Totalin Permanent structure |
|
|
N |
16.54 |
15.09 |
31.63kg |
Fe |
175 |
147 |
322g |
|
|
P |
2.8 |
2.77 |
5.57kg |
Mn |
80 |
76 |
156g |
|
|
K |
10.86 |
11.07 |
21.93kg |
Zn |
45 |
41 |
86g |
|
|
Ca |
12.22 |
18.97 |
31.19kg |
B |
35 |
42 |
77g |
|
|
Mg |
2.61 |
2.68 |
5.29kg |
Cu |
18 |
17 |
35g |
|
|
S |
2.05 |
2 |
4.05kg |
For example,stored Nand carbohydrate in roots,trunk and canesare mobilised early in the next growth cycle. ResearchusinglabelledNhasdemonstratedthisreservemobilisation aroundbudbreakandearlydevelopment.
Table13:Thecomplete15-Ton/acrenutrientbalance
Puttingthefourcategoriestogethergivesusamuchmoreusefulpicture:
|
Nutrient |
Harvested Grapes |
Pruning material |
Leaf/residue pool |
Permanent vine |
Annual uptake in Kg |
Nutrient |
Harvested grapes in g |
Pruning material in g |
Leaf/residue in g |
Permanent vine in g |
Annual uptake in g |
|
|
N |
26.6 |
32.8 |
20.25 |
31.6 |
131.5 |
Fe |
85 |
212 |
264.88 |
322 |
920 |
|
|
P |
5.73 |
4.94 |
4.249 |
5.57 |
22.3 |
Mn |
71 |
131 |
168 |
156 |
568 |
|
|
K |
43.7 |
27.5 |
27.2 |
21.9 |
127.2 |
Zn |
49 |
67 |
67.2 |
86 |
298 |
|
|
Ca |
11.6 |
22.7 |
23.056 |
31.2 |
91.7 |
B |
86 |
71 |
63.6 |
77 |
340 |
|
|
Mg |
4.39 |
4.92 |
5.44 |
5.29 |
21.4 |
Cu |
13 |
23 |
27.2 |
35 |
105 |
|
|
S |
4.01 |
4.16 |
3.354 |
4.05 |
17.8 |

About the author
Ravindra Thatte
Owner & Director, Eco Agro Services
Over 35 years in marketing high-quality agricultural inputs — chelated micronutrients, biostimulants and plant growth promoters.
View profile & all articles →